The Need for Dynamic Daylight Control
- Harvesting Daylight from View Windows
- The Sidelighting Challenge: Over-Shaded Windows
- The Solution: Dynamic Daylight Control (DDC)
- Summary of Key Points
Harvesting Daylight from View Windows
Admitting daylight into a daylit space is a balancing act. If there's too little daylight, there won't be enough savings to justify the cost of the daylighting equipment. But if there's too much daylight, the occupants will suffer the effects of glare, and cooling expenses will rise due to solar heating.
Maintaining this balance is easiest when the daylight comes from above, e.g. from skylights, atria, or clerestory windows. In fact, toplighting via skylights is considered so effective that California's Title 24 Energy Code mandates that 50% of the top-floor area of certain types of buildings be skylit.
Unfortunately, toplighting is feasible only on the top floors of buildings, or in buildings with ceilings high enough to allow use of clerestory windows. So, with the exception of enclosed shopping malls, toplighting represents only a small fraction of the floor area that could be daylit in conventional buildings.
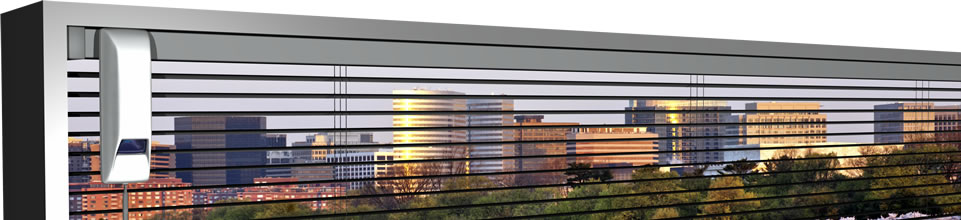
Instead, the greatest daylighting opportunity in existing and future construction—by far—is via sidelighting through view windows. View windows account for over 90% of the potential daylit area in existing buildings. As the name suggests, view windows are at eye level, and are therefore almost always shaded to control glare:
The Sidelighting Challenge: Over-Shaded Windows
Some view windows are tinted to control glare, but tinting causes a permanent reduction in visible transmittance (Tv), which reduces useful daylight even when there's no risk of glare. For that reason, most view windows are instead equipped with manually adjustable window coverings for glare control.
Most Office Buildings Use Horizontal Venetian Blinds
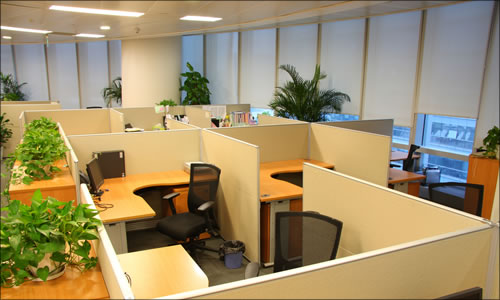
The most cost-effective and widely used type of adjustable window covering in U.S. office buildings is the interior-mounted horizontal Venetian blind. Interior horizontal blinds have dominated the domestic non-residental shading market for decades, and are currently used on 75% of all shaded non-residential windows in the U.S.
One reason horizontal blinds are so omnipresent is that they provide two degrees of adjustment freedom, enabling a wide range of control of both daylight and view:
Because Venetian blinds are so prevalent in non-residential buildings, there has been substantial research on how people actually use them. Good summaries of some of the seminal research on horizontal Venetian blind usage are given by Haldi and Robinson (2009) and Inkarojrit (2005).
Blinds are Rarely Adjusted
Unfortunately, while blinds are easy to operate, studies show that occupants of non-residential buildings rarely adjust them:
- Monitoring of 700 manually operated blinds across 6 buildings and two facade orientations (north and south) revealed that only 50 blinds were adjusted during a one-week period (Rubin et al. 1978, page 29).
- Observation of three facades of a 16-story office building showed that occupants made little or no attempt to change blind settings over the course of a day (Rea 1984, page 7).
- A total of 228 adjustments of manually operated blinds were observed in seven offices over a 58-day period, yielding an average adjustment rate of 0.7 per day. But in eight different offices equipped with motorized, remotely controlled blinds, 832 adjustments were observed over a 50-day period, for an average of 2.1 adjustments per day (Sutter et al. 2006, paragraph 3.2.1).
- A survey of 113 office occupants found that 64.6% of the respondents adjusted their blinds less than once per day, 17.7% adjusted their blinds once per day, and only 17.7% adjusted their blinds more than once per day (Inkarojrit 2005, page 117, Figure 4.11).
These and other studies confirm what seems intuitively obvious: like curtains and other window coverings, manually operated horizontal blinds aren't adjusted often enough to maximize useful, glare-free daylight. Instead, they're typically set to block glare under worst-case conditions, and then left alone for days or even weeks.
Average Occlusion is High
As might be expected, Venetian blind usage studies reveal that occlusion (i.e., the degree to which an installed blind's slats are lowered to cover the window area) is correlated with variables that drive the need for shading—and that the average occlusion can be very high for sunny exposures.
For example, Inoue et al (1988) found that, for windows from which the radiosity is occasionally high enough to cause discomfort, the occlusion is correlated with the maximum solar penetration depth. And Lambeva and Mahdavi found that the average occlusion in a given month is correlated with the peak global vertical irradiance over the same month.
Accordingly, in the northern hemisphere, the lowest observed occlusions are typically for north-facing windows, while the highest occlusions are for south-facing windows—and those occlusions typically exceed 50%.
For example, the following chart shows the south-facing facade of an office building equipped with horizontal Venetian blinds:
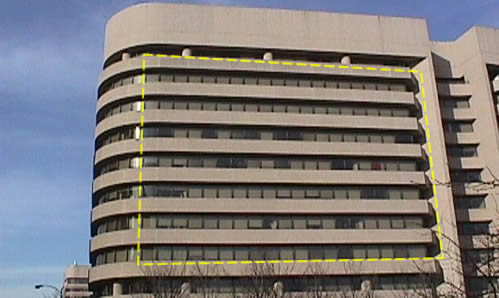
All 140 blinds delimited by the dotted yellow perimeter remained in the same positions for at least 48 hours, with an average occlusion of 82%. The top two floors have 100% occlusion, but even if they're excluded from the average, the remaining five floors still have an occlusion of 75%.
The available statistics show that the building of Chart 3 isn't an extreme example, but is rather quite typical of the occlusion on sunny exposures. The following chart shows the average occlusions reported in four seminal papers that investigated the impact of window orientation (note that not all studies addressed all four orientations):
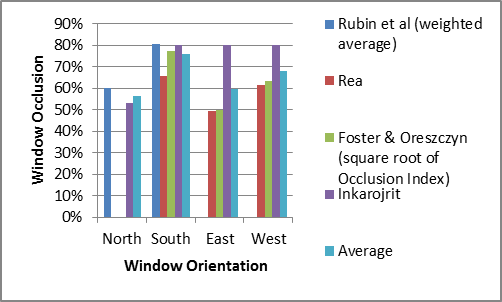
The values are in general agreement: occlusion on south-facing facades averages 70%, while average occlusion on the other facades is somewhat lower but still greater than 50%.
Unfortunately, only a couple of studies provide any information at all regarding the distribution of occlusion values from office to office and building to building:
- Rubin et al report occlusion distribution data for approximately 700 manually operated blinds across 6 buildings and two orientations (north and south) in 1978, well before mainstream use of video display monitors.
- Sutter et al report occlusion distribution data for 11 motorized blinds with southeast orientation in 2002, with the occupants of the subject offices spending most of their time looking at video display monitors.
The following chart shows the Cumulative Distribution Functions (CDFs) of the occlusions observed in the two studies:
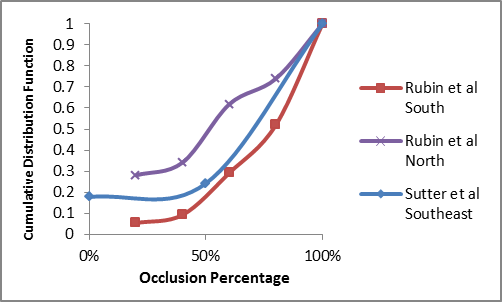
Despite the substantial differences in the study parameters, the CDF for the south blinds of Rubin et al are very similar to those for the southeast blinds of Sutter et al. The interpolated distributions suggest that, for a south or southeast exposure, 50% of blinds will have an occlusion greater than ~70%, and 25% of blinds will have an occlusion greater than 80%.
Slats are Mostly Closed
A unique capability of horizontal Venetian blinds is that, via adjustment of slat tilt, they can control the direction from which daylight is admitted:
Slat tilt is even more important than occlusion in understanding the impact of Venetian blind usage on interior daylight levels. Virtually all horizontal blinds used in office buildings raise from the bottom upwards, which means that windows are occluded from the top down. This is significant because the depth to which daylight will penetrate a room is proportional to the height of the daylight aperture above the floor. As a result, even a partially raised blind can substantially reduce the floor-averaged level of admitted daylight, depending on how its slats are tilted.
But while slat tilt statistics may be more significant than occlusion statistics, they're much harder to collect. Occlusion for even a large number of blinds can be quickly and accurately measured from photographs of building facades, but slat tilt angles are difficult to determine via image analysis, even with sophisticated image processing software. For that reason, only a couple of image-based Venetian blind usage studies have considered slat tilt:
- Rubin et al were the first to photographically collect slat tilt statistics, but were able to quantize tilt to only two designations ("open" and "closed"). The report provides no information on the approximate tilt ranges spanned by each designation, and the use of a single "open" designation means that nothing can be inferred about the frequency of settings that permit a sky view versus those that permit a ground view. Finally, the study was performed before video display monitors came into general use, which could reduce the relevance of the results to today's office environments.
- Foster and Oreszczyn combined measured slat tilt (quantized to three settings) with occlusion (quantized to five settings) to yield a composite occlusion index, but do not report slat tilt and occlusion statistics separately. Further, the quantized slat tilt settings represent just the magnitude—and not the direction—of tilt away from horizontal.
To date, only a couple of studies reporting slat tilt statistics make the distinction between tilt settings that afford a sky view and those that afford a ground view:
- Bulow-Hube (2001) manually estimated slat tilt (quantized to 15 degrees in 12 bins) via direct inspection of motorized exterior Venetian blinds on south-facing windows. However, the data were obtained as part of a controlled experiment in test rooms, not by long-term monitoring of operating offices.
- Sutter et al used a networked data collection system to collect slat tilt data from motorized interior blinds on the southeast facade of an operating office building. While the reported tilt is quantized to just three bins, separate bins are defined for positive (ground view) and negative (sky view) tilts.
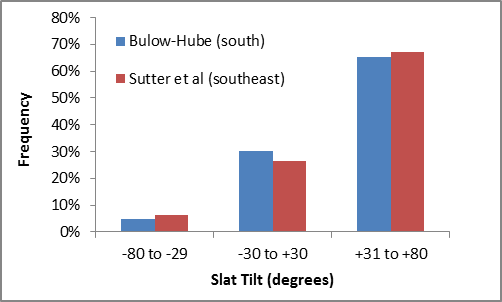
Bulow-Hube and Sutter et al had different research objectives and used different experiment designs, but their findings regarding slat tilt for sunny window exposures are similar. The following chart shows the frequency of slat tilt reported by both Bulow-Hube and Sutter et al, with the 12 bins of data from the former report down-sampled to the same three bins used in the latter report:
The relatively fine quantization used by Bulow-Hube enables determination of the distribution of observed slat tilt angles. The following chart plots the cumulative of that distribution:
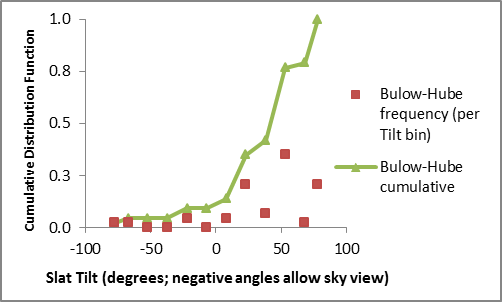
Thus, the data of Bulow-Hube suggest a median slat tilt of about +40 degrees for sunny exposures.
Average Occlusion and Slat Tilt Significantly Reduce Available Daylight
The high average window occlusion on sunny exposures, coupled with the high average slat-tilt angles, significantly reduce the daylight available for harvesting in sidelit spaces. The daylight loss can be estimated as the product of the occlusion loss and the slat-tilt loss.
Occlusion Loss
The loss in daylight due to occlusion (exclusive of any loss due to slat tilt) is modest:
- When occlusion is 0% (i.e. the slats are fully raised), there is no shading loss, regardless of the slat tilt.
- When the occlusion is 100% (i.e. the slats are fully lowered), the occlusion-only loss is the loss with slats tilted to maximize daylight admittance. This depends on the type of venetian blind and sun/sky conditions, but is generally around 30%.
- Between these extremes, the occlusion-only loss varies linearly with occlusion, i.e. between 0% and 30%.
Tilt Loss
The relative daylight loss with respect to tilt angle depends on factors such as the distance from the window to the point where the illuminance is measured, the type of venetian blind, the room geometry, the reflectivity of the room surfaces, the proximity and reflectivity of exterior objects such as buildings and foliage, the window azimuth orientation, and varying weather and sky conditions. This leads to a distribution of loss-versus-tilt characteristics across the population of potential sidelit areas.
One way to characterize the tilt loss is by plotting the horizontal daylight illuminance versus slat tilt, normalized so that the peak illuminance over the tilt range is 1.0. We refer to this as the Relative Daylight Illuminance (RDI).
The following chart plots the RDIs measured in two sidelit areas in the Washington DC metropolitan area (one with a western exposure and one with a northern exposure), with each curve representing a different combination of office, time of day, sky condition, and distance to window (ranging from 0.9 to 1.8 window heights). Also plotted is our best estimate of the median RDI curve across the entire potential sidelit area in U.S. office buildings:
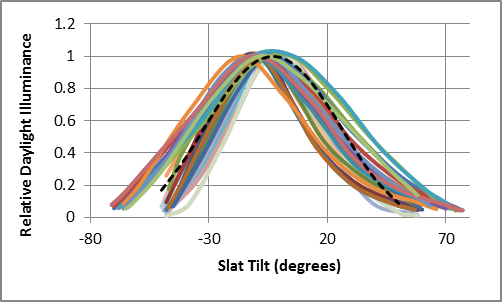
At a slat-tilt of +20 degrees for sunny exposures, the estimated median RDI is about 0.7, resulting in a relative daylight loss of only 30%. However, the loss increases steadily with tilt angle, reaching 95% at 60 degrees.
Cumulative Distribution Function of Relative Daylight Illuminance
The occlusion and slat tilt distributions previously shown in Charts 5 and 8, along with the dependencies of daylight loss on occlusion and tilt discussed above, can be used to estimate the distribution of the long-term-average Relative Daylight Illuminance (RDI) across potential sidelit areas in U.S. office buildings.
In order to do this, it's necessary to make an assumption about the correlation between occlusion and slat tilt. Unfortunately, only one study (Rubin et al) explicitly addresses the relationship between occlusion and slat tilt, and suprisingly found an inverse correlation—i.e. high occlusion values were associated with low tilt values, and vice-versa. However, the data were collected before widespread use of video-display terminals, and the slat tilt was quantized to just two values (open and closed).
Results of this study notwithstanding, there is circumstantial evidence that occlusion and slat tilt are positively correlated. For example, occlusion has been found to be correlated with both solar penetration depth and average monthly global irradiance—neither of which can be controlled via occlusion alone (i.e. without also tilting the slats). And average occlusion and slat tilt are both relatively high on windows with sunny exposures, and relatively low on windows with northern exposures. So the following discussion assumes a positive correlation*.
Per this assumption (and the preceding discussion), the following charts plot the Cumulative Distribution Functions (CDF) of the average horizontal RDI from windows shaded by Venetian blinds in potential sidelit areas in existing office buildings. The curves are normalized so that an RDI of 1.0 corresponds to the horizontal workplane illuminance due to daylight from an unshaded window, averaged across a sidelit area extending inward 2.0 window-head-heights from the window. The chart plots five RDI CDFs:
- An "actual" CDF, based on the published occlusion and slat tilt statistics above, that represents the average RDI over a two-zone sidelit depth.
- An adjusted CDF, based on our own independent research, of the RDI over the two zone depth.
- An adjusted CDF for RDI over the near-zone only (extending inward just 1.0 window-head-heights from the window).
- CDFs based on occlusion losses only (i.e. assuming that the slats are always tilted to maximize the admitted daylight), per the occlusion statistics discussed above, for two zones as well as the near zone.
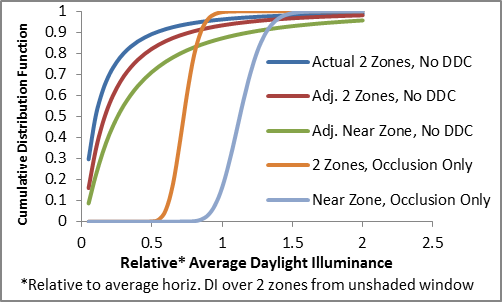
The "adjusted" CDFs are based on our own research that indicates a somewhat lower overshading loss than the published statistics above. For conservatism, all of the savings and payback projections herein are based on these adjusted CDFs.
As the Chart shows, the median "adjusted" RDIs are no greater than 0.25, which corresponds to a loss in available daylight of at least 75%. On the other hand, if Venetian blind slats were always tilted fully open, then—per the occlusion-only curves—the median RDIs would be about 0.6 and 1.0 for two zones and the near zone, respectively. The difference between the adjusted and occlusion-only CDFs represents the daylight loss due to occupant-selected slat-tilt settings. Some of that loss is unavoidable, because the slats must occasionally be closed to block excessive brightness and solar heating. But much of the gap between the adjusted and occlusion-only CDFs represents useful daylight that could be recovered if Venetian blind slats were closed only when necessary.
Lost Daylight Means Lost Savings
In a daylight-harvesting installation, lost daylight translates directly to lost savings. The savings loss depends on the type of daylight-harvesting lighting control as well as on the daylight loss. If a lighting control's savings-versus-daylight illuminance function* is known, then it can be used to convert RDI CDFs such as those shown in Chart 10 into savings CDFs.
For example, the following chart plots relative savings CDFs for a Switching-Only (SO) lighting control in a near-zone sidelit area extending from 0 to 1 window-head-heights from a window with a sunny exposure:
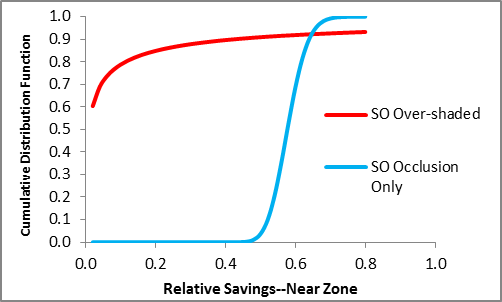
An SO type lighting control saves 100% of the lighting power (and energy) when the daylight illuminance is greater than the lighting set-point, but zero power (and energy) when the illuminance is less than the set-point. With typical shading settings, the daylight illuminance is rarely greater than the set-point, yielding median savings of only a few percent. But if the Venetian blind slats were always tilted fully open, then the illuminance is often greater than the set-point, and the median savings jump to nearly 60%.
As another example, the following chart plots relative savings CDFs for a state-of-the-art Dimming-and-Switching (D&S) lighting control in a two-zone configuration, with the sidelit area extending inward 2.0 window-head-heights from the window.
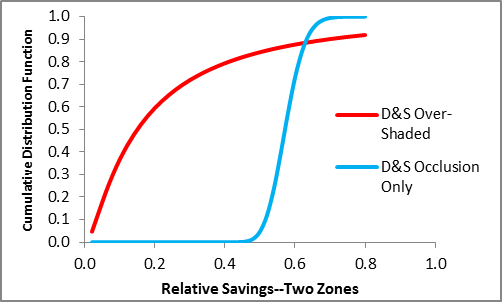
D&S controls can save energy even when the daylight level is below the set-point. But with typical shading settings, the daylight illuminance is so low--especially in the far zone--than the median overall savings are less than 20%. On the other hand, if the Venetian blind slats were always tilted fully open, then the median savings would jump to almost 60%.
Of course, as previously noted, the "open slat" CDF curves in the charts above could never be achieved in practice (because the slats must occasionally be closed to block excessive brightness and solar heating), and are shown only to bound the shading losses.
Real-World Savings Consistent with Substantial Shading Losses
According to a 2005 study—perhaps the most comprehensive study to date of the actual, real-world savings provided by daylight-harvesting lighting controls in sidelit spaces—the average relative savings in lighting energy were 3.59 Full-Load-Hours (FLH) in spaces without blinds, but only 1.84 FLH in spaces with blinds ("Sidelighting Photocontrols Field Study" 2005, Appendix F, Table of Full Load Hour Savings). Thus, the spaces with blinds were providing only about 50% of the relative energy savings of the spaces without blinds.
And because many of the windows without blinds were north-facing (which substantially reduces the savings from daylight harvesting), these statistics imply a much greater actual savings loss due to over-shading, perhaps 66–75%.
The researchers noted that 83% of the sample spaces had window blinds, and made the following observation: "Overall, occupants' choice for the setting of their blinds is clearly an important factor in the energy performance of the systems, since net visible light transmittance accounting for the blinds setting was a better predictor of energy savings than simple glazing Tvis" (Ibid., page 9).
The Solution: Dynamic Daylight Control (DDC)
The solution to the problem of over-shading with Venetian blinds was recognized as early as the 1960's: adjust the slat tilt automatically to maintain the optimum shading as conditions change.
With this form of Dynamic Daylight Control (DDC), the slats are closed only when (and as much as) necessary to control excessive brightness and solar heating. As a result, the average daylight level is substantially greater than with manually operated blinds:
- In offices with sunny exposures, the conditions that cause people to close the blinds (e.g. low-angle direct sun in clear skies) typically occur over only a small percentage (e.g. 20%) of annual daylight hours. For the balance of the time, in most offices, the blinds can be fully opened without risk of glare and without exceeding the illuminance set-point of the daylight-harvesting lighting system.
- The shading settings in offices typically reflect the worst-case glare conditions. So, for most of the exemplar 20% mentioned above, the windows are still modestly over-shaded, so that the blinds can be opened to at least some degree without causing glare or exceeding the illuminance set-point.
Triples the Median Relative Daylight Illuminance (RDI)
The following charts show the Relative Daylight Illuminance (RDI) CDFs previously shown in Charts 10, but with added CDFs for DDC:
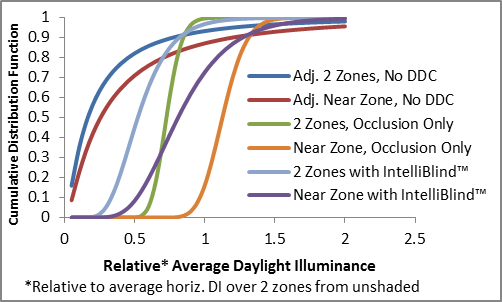
The median RDIs with DDC are more than triple those of the median RDIs without DDC. DDC doesn't completely eliminate the over-shading loss, but recovers most of the lost daylight—without any risk of excessive brightness or glare.
More than Doubles the Median Savings
Increased daylight means increased savings, and the increase in savings due to DDC is especially dramatic with Switching-Only (SO) controls. For example, the following chart plots the relative savings CDFs previously shown in Chart 11 for Switching-Only (SO) lighting controls in near-zone sidelit areas—but with an additional CDF for DDC:
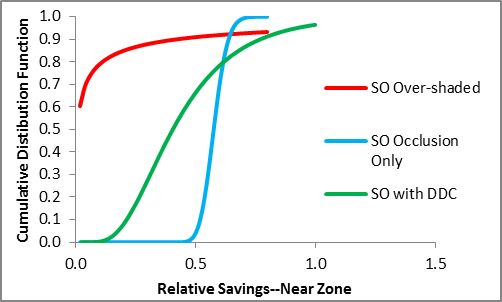
DDC boosts the median savings by an order of magnitude, from less than 4% to about 40%. The huge increase is due to the fact that the increased daylight is enough to keep the lights mostly "off", whereas with manually operated blinds the lights are mostly "on".
The relative (i.e. percentage) increase in savings aren't as great with dimming controls, but the absolute increase in savings are comparable. For example, the following chart plots the relative savings CDFs previously shown in Chart 12 for a Dimming-and-Switching (D&S) control in two-zone sidelit area—but with an additional CDF for DDC:
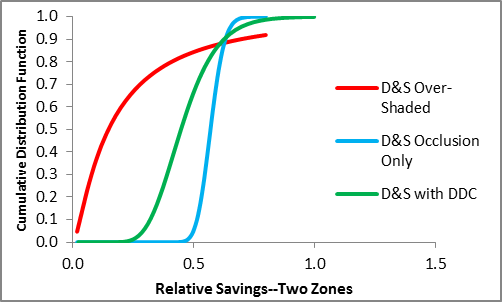
DDC boosts the savings from 15% to 45%, recovering almost all of the savings lost due to shading.
Effectiveness Demonstrated via Independent Research
The effectivess of DDC in daylight harvesting applications was demonstrated decades ago. In the mid to late 1990's, Lawrence Berkeley National Laboratory (LBNL) conducted a multi-year research program in which dynamic daylighting systems were prototyped and subjected to partial-scale and full-scale testing. The research was extensively documented; see, for example, DiBartolomeo et al (1996), Lee at al (1998), and Lee and Selkowitz (1998), and Lee et al (2000).
The prototype systems provided both DDC and daylight-harvesting capabilities, and consisted of an interior-mounted horizontal blind (or, in some cases, an electrochromic window), a dimmable/switchable electronic ballast, various sensors, and a control computer.
The LBNL researchers investigated a variety of control protocols, but in general the computer periodically adjusted the shading to be as "open" as possible without admitting direct sun or exceeding an illuminance set-point. Meanwhile, the lighting level was adjusted to just fill the gap, if any, between the illuminance set-point and the daylight illuminance.
The results confirmed that this form of DDC can double the savings from daylight harvesting in sidelit spaces—essentially recovering the savings lost through over-shaded windows—with no compromise in the comfort or convenience of the building occupants. And because DDC prevents excessive daylight levels, the savings in lighting energy were obtained without the penalty of substantially increased cooling costs.
Summary of Key Points
- The bulk of the potential daylit area in office buildings is sidelit via eye-level view windows, which must be shaded to avoid occasional glare
- In the USA, office windows are typically shaded with interior-mounted horizontal venetian blinds that offer adjustable occlusion as well as adjustable slat tilt
- However, extensive research shows that non-residential blinds are rarely adjusted, typically remaining at the same setting for days or even weeks
- The occlusion and slat tilt are correlated with the maximum window insolation over the interval between adjustments
- For windows occasionally receiving enough sun to cause glare (i.e. for about 75% of all windows), the median window occlusion is about 70%, while the median slat tilt is about +40 degrees with respect to horizontal
- This median occlusion and slat tilt reduce daylight admittance by about 75% relative to a fully lowered blind with horizontal (i.e. fully open) slats
- Over most of the interval between adjustments, the window insolation is far lower than its peak value, so windows are over-shaded most of the time. As a result, the average loss in harvestable daylight relative to an optimally adjusted blind is also nearly 75%
- This over-shading loss reduces the savings achievable through daylight harvesting by 50–75%, depending on the type of lighting control and the depth of the sidelit area
- The only way to recover the lost savings is by automatically adjusting the shading in response to changing conditions. In fact, the effectiveness of this form of Dynamic Daylight Control (DDC) was established decades ago through government-sponsored research: a correctly implemented DDC system will, indeed, double the savings from daylight harvesting without compromising the comfort or convenience of the building occupants.